The purpose of calculating irradiance and insolation is to determine the amount of sunlight photovoltaic panels can absorb. This is useful in deciding upon the size of a photovoltaic system and the number of solar panels that will be necessary to provide enough electricity for a home or business. If you take the number of kW of the system, and multiply it by the average hours for the area it will be installed, that’s how many kWh on average the system will produce.
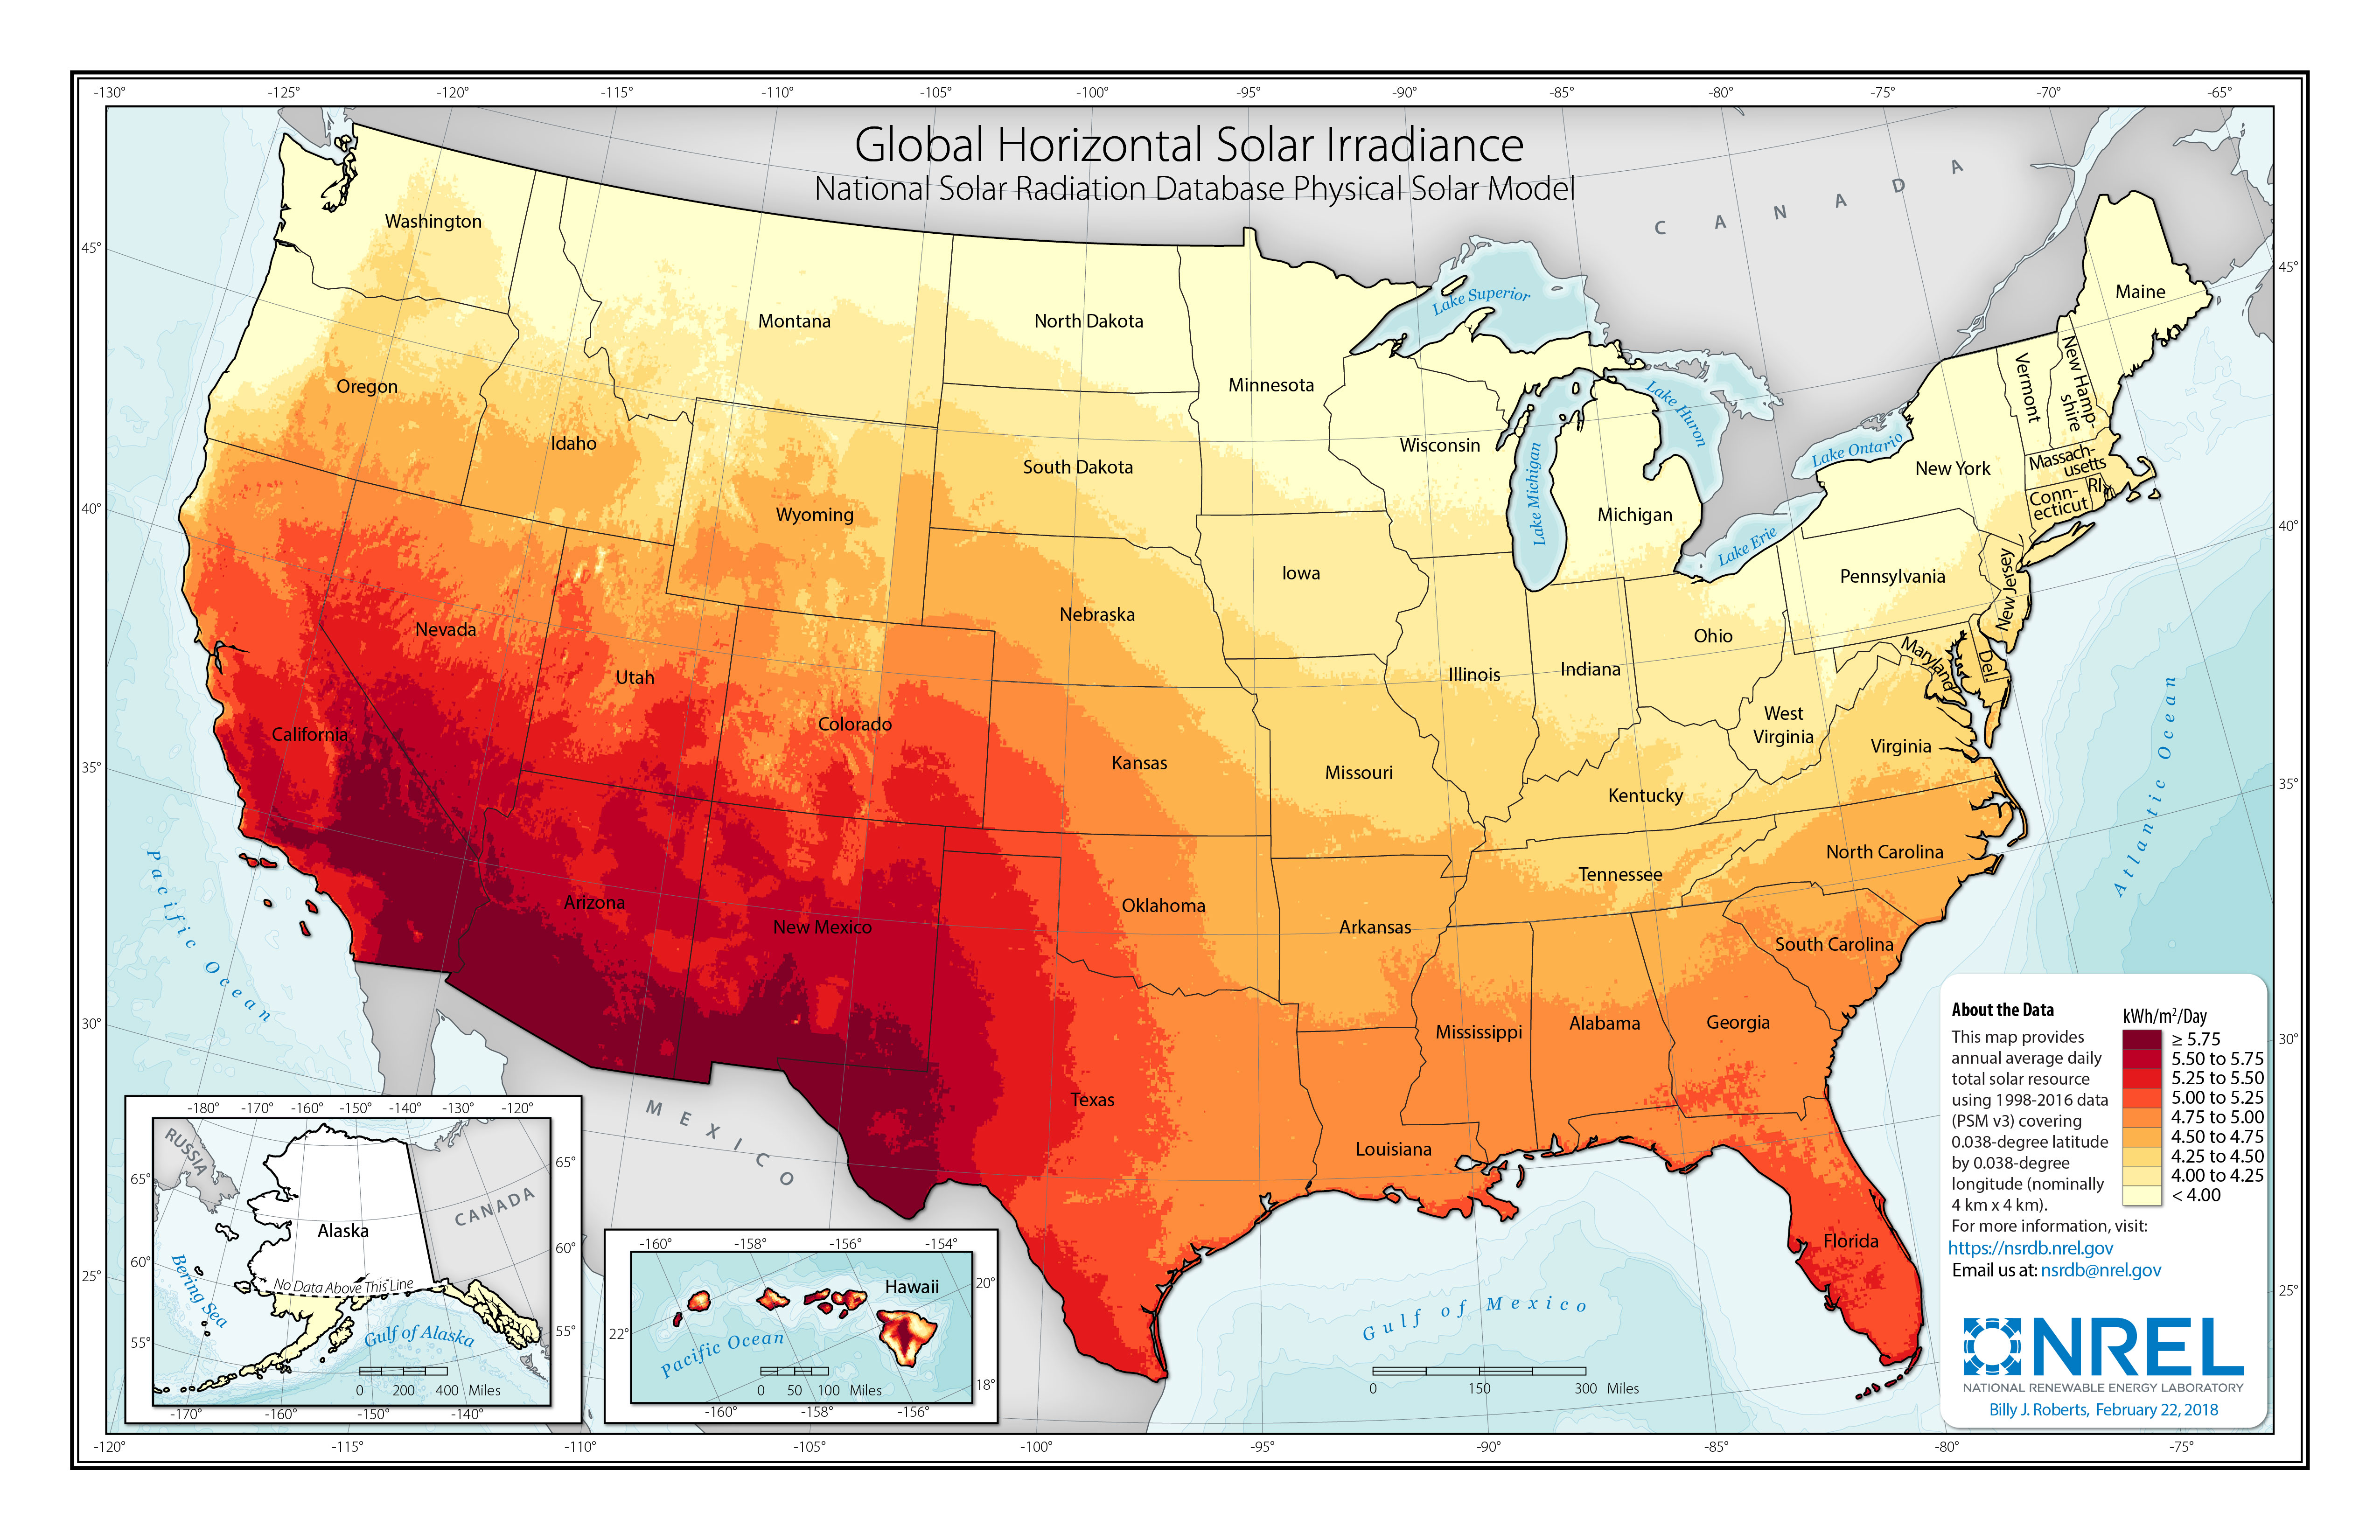
The map gives you a visual, but with the chart you should be able to determine a reasonable estimate of the sun’s availability in your area.
| State, City | Summer Avg. | Winter Avg. | Year Avg. |
|---|---|---|---|
| AL, Montgomery | 4.69 | 3.37 | 4.23 |
| AK, Bethel | 6.29 | 2.37 | 3.81 |
| AK, Fairbanks | 5.87 | 2.12 | 3.99 |
| AK, Mantanuska | 5.24 | 1.74 | 3.55 |
| AZ, Page | 7.3 | 5.65 | 6.36 |
| AZ, Phoenix | 7.13 | 5.78 | 6.58 |
| AZ, Tucson | 7.42 | 6.01 | 6.57 |
| AR, Little Rock | 5.29 | 3.88 | 4.69 |
| CA, Davis | 6.09 | 3.31 | 5.1 |
| CA, Fresno | 6.19 | 3.42 | 5.38 |
| CA, Inyokem | 8.7 | 6.97 | 7.66 |
| CA, La Jolla | 5.24 | 4.29 | 4.77 |
| CA, Los Angeles | 6.14 | 5.03 | 5.62 |
| CA, Riverside | 6.35 | 5.35 | 5.87 |
| CA, Santa Maria | 6.52 | 5.42 | 5.94 |
| CA, Soda Springs | 6.47 | 4.4 | 5.6 |
| CO, Boulder | 5.72 | 4.44 | 4.87 |
| CO, Granby | 7.47 | 5.15 | 5.69 |
| CO, Grand Junction | 6.34 | 5.23 | 5.86 |
| CO, Grand Lake | 5.86 | 3.56 | 5.08 |
| D. C. Washington | 4.69 | 3.37 | 4.23 |
| FL, Apalachicola | 5.98 | 4.92 | 5.49 |
| FL, Belle Island | 5.31 | 4.58 | 4.99 |
| FL, Gainesville | 5.81 | 4.71 | 5.27 |
| FL, Miami | 6.26 | 5.05 | 5.62 |
| FL, Tampa | 6.16 | 5.26 | 5.67 |
| GA, Atlanta | 5.16 | 4.09 | 4.74 |
| GA, Griffin | 5.41 | 4.26 | 4.99 |
| HI, Honolulu | 6.71 | 5.59 | 6.02 |
| IA, Ames | 4.8 | 3.73 | 4.4 |
| ID, Twin Falls | 5.42 | 3.41 | 4.7 |
| ID, Boise | 5.83 | 3.33 | 4.92 |
| IL, Chicago | 4.08 | 1.47 | 3.14 |
| IN, Indianapolis | 5.02 | 2.55 | 4.21 |
| KS, Dodge City | 4.14 | 5.28 | 5.79 |
| KS, Manhattan | 5.08 | 3.62 | 4.57 |
| KY, Lexington | 5.97 | 3.6 | 4.94 |
| LA, Lake Charles | 5.73 | 4.29 | 4.93 |
| LA, New Orleans | 5.71 | 3.63 | 4.92 |
| LA, Shreveport | 4.99 | 3.87 | 4.63 |
| MA, Blue Hill | 4.38 | 3.33 | 4.05 |
| MA, Boston | 4.27 | 2.99 | 3.84 |
| MA, E. Wareham | 4.48 | 3.06 | 3.99 |
| MA, Lynn | 4.6 | 2.33 | 3.79 |
| MA, Natick | 4.62 | 3.09 | 4.1 |
| MD, Silver Hill | 4.71 | 3.84 | 4.47 |
| ME, Caribou | 5.62 | 2.57 | 4.19 |
| ME, Portland | 5.2 | 3.56 | 4.51 |
| MI, E. Lansing | 4.71 | 2.7 | 4 |
| MI, Sault Ste. Marie | 4.83 | 2.33 | 4.2 |
| MN, St. Cloud | 5.43 | 3.53 | 4.53 |
| MO, Columbia | 5.5 | 3.97 | 4.73 |
| MO, St. Louis | 4.87 | 3.24 | 3.78 |
| MS, Meridian | 4.86 | 3.64 | 4.44 |
| MT, Glasgow | 5.97 | 4.09 | 5.15 |
| MT, Great Falls | 5.7 | 3.66 | 4.93 |
| MT, Summit | 5.17 | 2.36 | 3.99 |
| NC, Cape Hatteras | 5.81 | 4.69 | 5.31 |
| NC, Greensboro | 5.05 | 4 | 4.71 |
| ND, Bismark | 5.48 | 3.97 | 5.01 |
| NE, Lincoln | 5.4 | 4.38 | 4.79 |
| NE, North Omaha | 5.28 | 4.26 | 4.9 |
| NJ, Sea Brook | 4.76 | 3.2 | 4.21 |
| NM, Albuquerque | 7.16 | 6.21 | 6.77 |
| NV, Ely | 6.48 | 5.49 | 5.98 |
| NV, Las Vegas | 7.13 | 5.83 | 6.41 |
| NY, Bridge Hampton | 3.93 | 1.62 | 3.16 |
| NY, Ithaca | 4.57 | 2.29 | 3.79 |
| NY, New York | 4.97 | 3.03 | 4.08 |
| NY, Rochester | 4.22 | 1.58 | 3.31 |
| NY, Schenectady | 3.92 | 2.53 | 3.55 |
| OH, Cleveland | 4.79 | 2.69 | 3.94 |
| OH, Columbus | 5.26 | 2.66 | 4.15 |
| OK, Oklahoma City | 6.26 | 4.98 | 5.59 |
| OK, Stillwater | 5.52 | 4.22 | 4.99 |
| OR, Astoria | 4.76 | 1.99 | 3.72 |
| OR, Corvallis | 5.71 | 1.9 | 4.03 |
| OR, Medford | 5.84 | 2.02 | 4.51 |
| PA, Pittsburgh | 4.19 | 1.45 | 3.28 |
| PA, State College | 4.44 | 2.78 | 3.91 |
| RI, Newport | 4.69 | 3.58 | 4.23 |
| SC, Charleston | 5.72 | 4.23 | 5.06 |
| SD, Rapid City | 5.91 | 4.56 | 5.23 |
| TN, Nashville | 5.2 | 3.14 | 4.45 |
| TN, Oak Ridge | 5.06 | 3.22 | 4.37 |
| TX, Brownsville | 5.49 | 4.42 | 4.92 |
| TX, El Paso | 7.42 | 5.87 | 6.72 |
| TX, Fort Worth | 6 | 4.8 | 5.83 |
| TX, Midland | 6.33 | 5.23 | 5.83 |
| TX, San Antonio | 5.88 | 4.65 | 5.3 |
| UT, Flaming Gorge | 6.63 | 5.48 | 5.83 |
| UT, Salt Lake City | 6.09 | 3.78 | 5.26 |
| VA, Richmond | 4.5 | 3.37 | 4.13 |
| WA, Prosser | 6.21 | 3.06 | 5.03 |
| WA, Pullman | 6.07 | 2.9 | 4.73 |
| WA, Richland | 6.13 | 2.01 | 4.43 |
| WA, Seattle | 4.83 | 1.6 | 3.57 |
| WA, Spokane | 5.53 | 1.16 | 4.48 |
| WV, Charleston | 4.12 | 2.47 | 3.65 |
| WI, Madison | 4.85 | 3.28 | 4.29 |
| WY, Lander | 6.81 | 5.5 | 6.06 |
| Province, City | |||
| Alberta, Edmonton | 4.95 | 2.13 | 3.75 |
| Alberta, Suffield | 5.19 | 2.75 | 4.1 |
| British Columbia, Kamloops | 4.48 | 1.46 | 3.29 |
| British Columbia, Prince George | 4.13 | 1.33 | 3.14 |
| British Columbia, Vancouver | 4.23 | 1.33 | 3.14 |
| Manitoba, The Pas | 5.02 | 2.02 | 3.56 |
| Manitoba, Winnipeg New Brunswick | 5.23 | 2.77 | 4.02 |
| Fredericton | 4.23 | 2.54 | 3.56 |
| Newfoundland, Goose Bay | 4.65 | 2.02 | 3.33 |
| Newfoundland, St. Johns | 3.89 | 1.83 | 3.15 |
| Northwest Territory, Fort Smith | 5.16 | 0.88 | 3.29 |
| Northwest Territory, Norman Wells | 5.04 | 0.06 | 2.89 |
| Nova Scotia, Halifax | 4.02 | 2.16 | 3.38 |
| Ontario, Ottawa | 4.63 | 2.35 | 3.7 |
| Ontario, Toronto | 3.98 | 2.13 | 3.44 |
| Prince Edward Isl., Charlottetown | 4.31 | 2.29 | 3.56 |
| Quebec, Montreal | 4.21 | 2.29 | 3.5 |
| Quebec, Sept-Isles | 4.29 | 2.33 | 3.5 |
| Saskatchewan, Swift Current | 5.25 | 2.77 | 4.23 |
| Yukon, Whitehorse | 4.81 | 0.69 | 3.1 |